


![]()
It is a challenge running a Kickstarter project. Your life is tied to a number that you have very little control over, and that number defines you for the next month. Every pledge sends a notification to your inbox, giving you a rush of micro-excitement. You check your Kickstarter dashboard and see the trajectory of your funding progress heading towards the dotted goal line. As the clock runs down and you hit your funding goal, congratulatory messages begin to pour in, you pump your fist into the air, exchange high-fives with your teammates and pop the celebratory champagne that you have been saving.
Then the real work begins.
In this Project by Numbers analytic series, we will look at what happens after the project- backer numbers, pledges, add-ons, traffic sources etc… For the first month, we will look at numbers from one of 2013’s most popular project, Federal 52 Part II – the backers, the pledges and where do these majestic decks get shipped to.
To start off, we want to thank Jackson Robinson of Kings Wild Project for sharing the data and giving us a very rare insight of the numbers that make up this awesome project.

The Project
The Federal 52 Part II project was launched on 15 June 2013 with a funding goal of $16k. Within 20 mins of the launch, the project reached its funding goal!
Here’s a quick overview of the project:
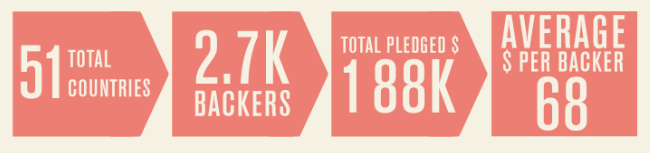
Overall, the project is the second most funded playing card project on Kickstarter and third in terms of backer numbers.
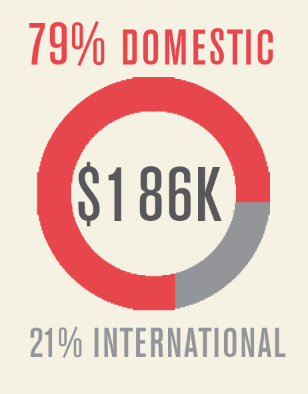
Pledges
Looking at the amount pledged of $186k, a large percentage of backers are United States based (domestic). Note that 2% of pledges did not get banked due non-processed credit card errors.
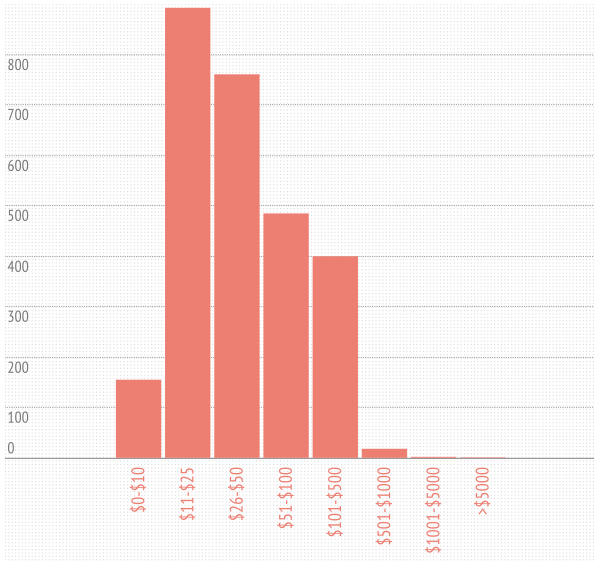
From the total amount, 61% of the backers pledged $26 and above. The most popular pledge seem to be the $11-$25 level, which is the 1 and 2 decks reward tier. Histogram as follows:
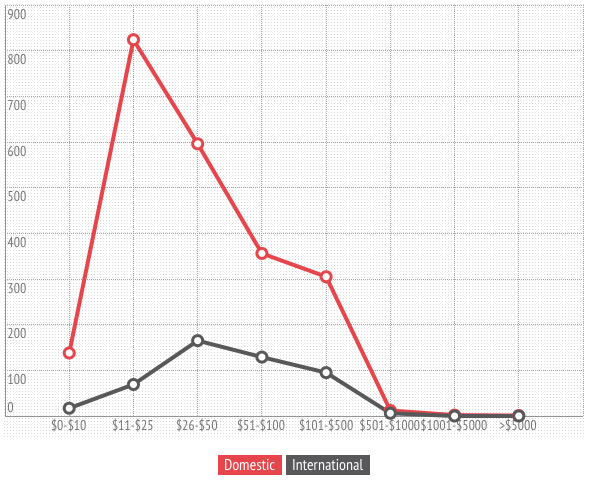
Breaking it down further to examine the pledge levels of both domestic and international backers.
Backers
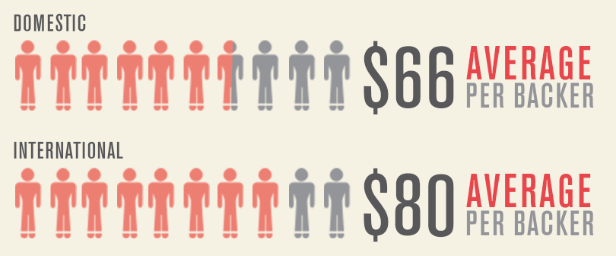
Looking at backer numbers, the 2.7k backers are made out of
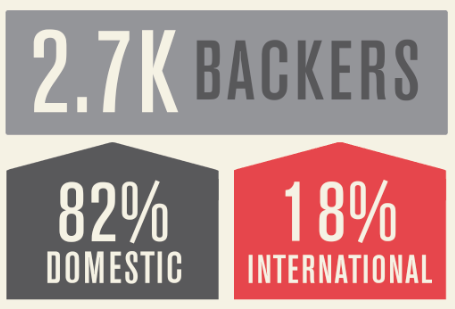
International backers pledged on average 22% higher
than domestic backers. The international price of shipping could be a factor in this price differential.
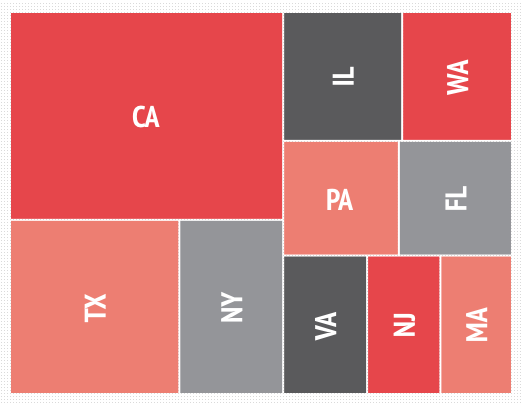
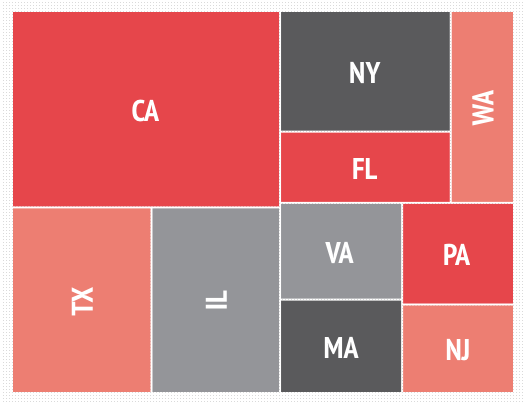
Where do majority of the domestic backers come from? Here are the top 10 states by number of domestic backers:
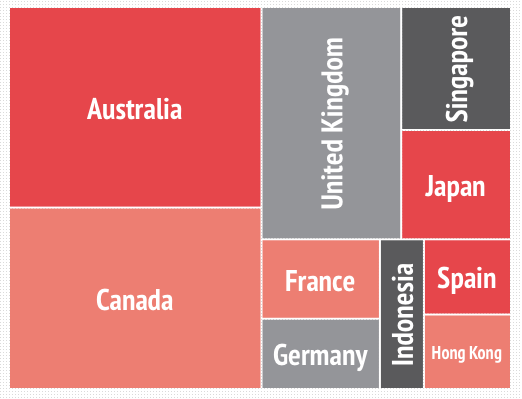
While the top 10 countries by backer numbers:
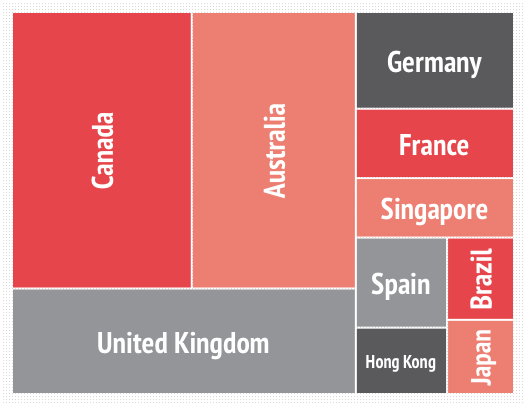
It is interesting to note that the top 10 form both domestic and international make up 60% of the total project backers!
Where do they go?
Here’s a global view (based on backer numbers) of where the Silver Certificates and Reserve Notes will go:
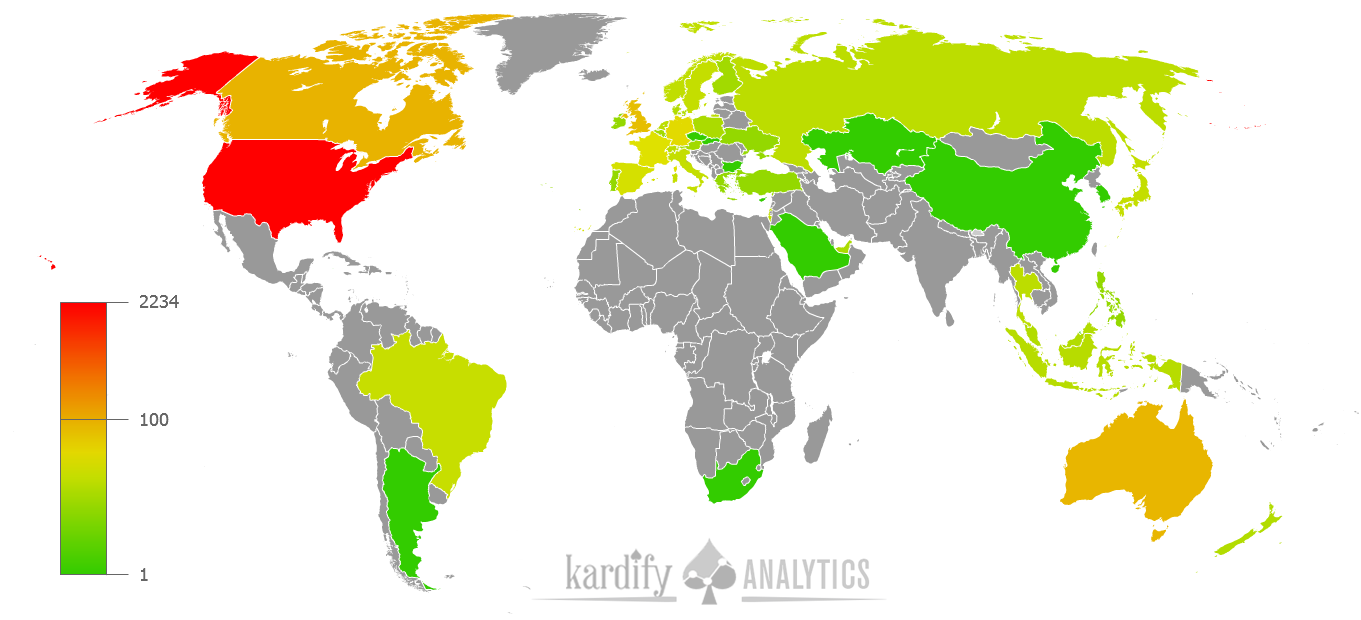
Note that the decks will be delivered to 50 different countries around the world. In terms of spending, here are the top 10 domestic states in terms of pledge size.
As for international, pledge size by country.
Based on these numbers, we hope you will better understand and appreciate the complexities of a project. Next month, we will look at where all the playing card projects come from and the month after, we will look at traffic sources (external vs internal) of a number of Kickstarter project- where do they come from and what % do they contribute towards the funding goal.


